NCATS 4DM · biologics
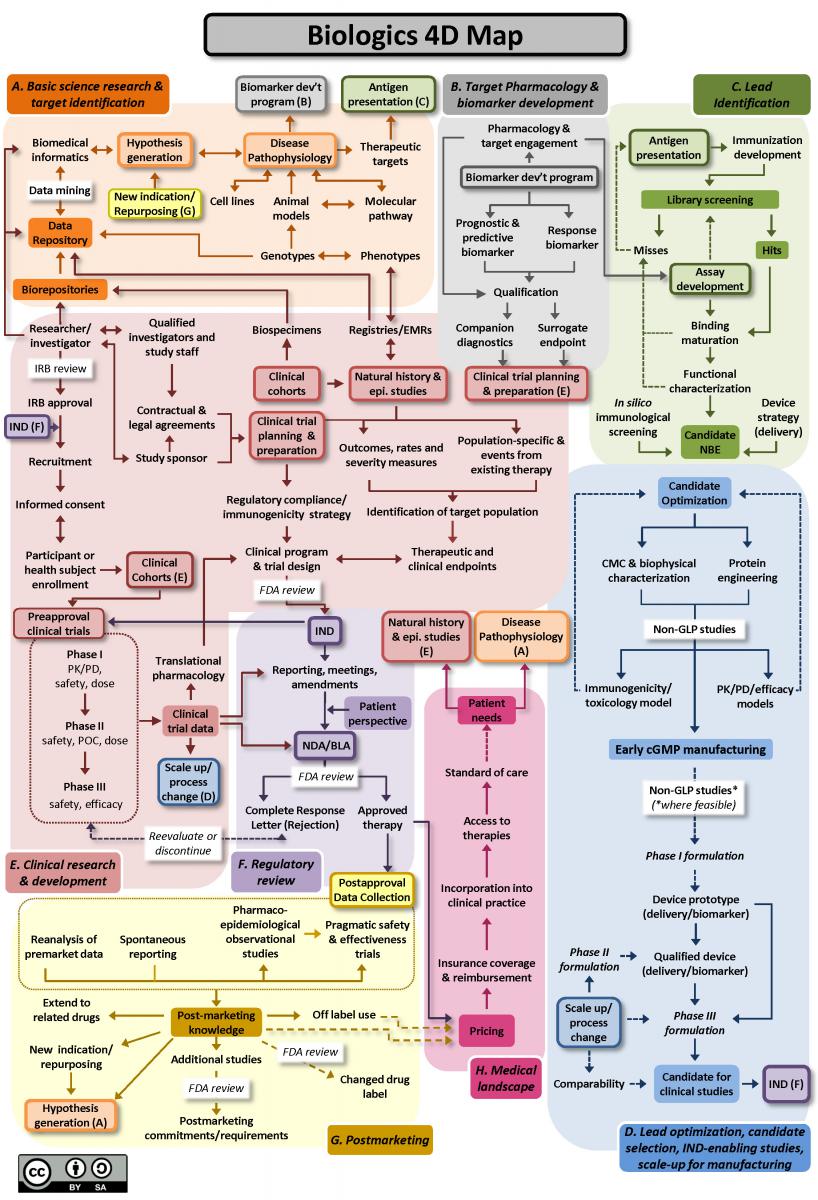
The Drug Discovery, Development and Deployment Map for biologics, drawn with monoclonal antibodies as the representative therapeutic. It lays out the modern therapeutic development process as eight connected neighborhoods rather than a straight line, so the dependencies that actually govern a program — and the bottlenecks between them — are visible in one view. Published by NCATS at the NIH and reproduced here under CC BY-SA 4.0.
Six of the eight neighborhoods are common to both 4D Maps. Two are not — and they are the two that decide what a program actually looks like day to day: C, lead identification, and D, lead optimization. Two more, E and F, carry small but consequential biologics-only additions.
Antigen presentation and immunization development feed library screening and assay development. What follows has no small-molecule counterpart at all: binding maturation, functional characterization, in silico immunological screening, and a delivery-device strategy that starts here rather than at formulation. The neighborhood exits with a candidate new biological entity (NBE) instead of a screened compound.
Candidate optimization branches into CMC and biophysical characterization and into protein engineering. Non-GLP studies split between immunogenicity and toxicology models and PK/PD/efficacy models — immunogenicity is a first-class concern for a biologic, not a footnote. Early cGMP manufacturing arrives much earlier in the sequence than it does for a small molecule, and formulation is staged rather than settled once: Phase I formulation, then Phase II, then Phase III, with a device prototype and a qualified device tracked alongside. Any scale-up or process change forces a comparability exercise before the candidate can proceed to clinical studies.
Clinical development carries a combined regulatory-compliance and immunogenicity strategy where the small-molecule map carries compliance alone. Regulatory review runs to an NDA/BLA rather than an NDA, and exits to approved therapy or a Complete Response Letter.
The small-molecule map replaces C and D wholesale with high-throughput screening, medicinal and process chemistry, and long-term toxicology. Comparing the two side by side is the fastest way to see why a modality choice is a program-structure choice.
Substantively the same on both maps:
DISCLAIMER: Reference visualization for educational purposes only. Not legal, regulatory, or medical advice. Consult qualified professionals.